library(tidyverse)
library(geomtextpath)
library(ggimage)
library(cropcircles)
library(magick)
library(glue)Why on earth did I try this?
It’s no secret, I love working with images in data visualizations. When I’m working with ggplot2, I often import ggimage to plot images as geoms.
This idea of wrapping text around a circular image came about when I was experimenting with a beeswarm plot to show Spotify Artist’s popularity ratings. My idea was heavily inspired by one of my favorite pieces by Matt Daniels about hip-hop artists and their respective vocabulary sizes. But unlike Matt’s cool interactive graphic, my visual would remain static.
The problem I needed to solve for: how can I incorporate the artist’s name sans tooltip? How can we make the most use of space without overlapping? So I thought “well, let’s try text wrapping” - and that’s how this entire crazy experiment began.

Getting Started
After a lot of Googling and StackOverflowing, I discovered this was not going to be an easy walk in the park. No one package or library was going to solve my problem, I needed to do something custom.
Luckily, there were lots of cool libraries that addressed different parts of my problem. The heroes that did the heavy lifting include:
Creating The Custom Function
Next step, we used these libraries to create our own custom function to generate a ggplot2 rendering of the image with text.
The gist of the function: take the image, crop it into a circle with cropcircles, then use some math to create the outer curve for the text label that we’ll use with geomtextpath, and finally put it all together with ggplot2.
plot_image_label<-function(image,
                           label,
                           font_color="black",
                           position="top",
                           hjust=0.2){

  #crop the image into a circle shape
  cropped_image = cropcircles::circle_crop(image)

  t = seq(0, 1, length.out = 100) * pi

  #set up params based on top or bottom
  if(position=="top"){
    data = data.frame(x = cos(t),y = sin(t))
    vjust=1.1
    ymax=1.2
    ymin=-0.9}

  else if(position=="bottom"){
    data=data.frame(x = cos(t),y = sin(t)*-1)
    vjust=-0.1
    ymax=0.9
    ymin=-1.2}

  #plot
  ggplot() +
    geom_image(aes(x=0, y=0, image = cropped_image), asp=2.4/2.1, size=.7) +
                 scale_x_continuous(limits = c(-1.2, 1.2))+
                 scale_y_continuous(limits=c(ymin, ymax))+
                 geom_textpath(data = data, aes(x,y,label =label), linecolor=NA, color=font_color,
                               size = 14.5,  fontface="bold", vjust = vjust, hjust=hjust)+
                 coord_equal()+
                 theme_void()
}
Using The Function
Now let’s see it in action. For this example, I’m picking on TSwift.
#image of taylor swift
image_url<-"https://i.scdn.co/image/ab6761610000e5eb5a00969a4698c3132a15fbb0"


plot_image_label(image=image_url, label="TAYLOR SWIFT")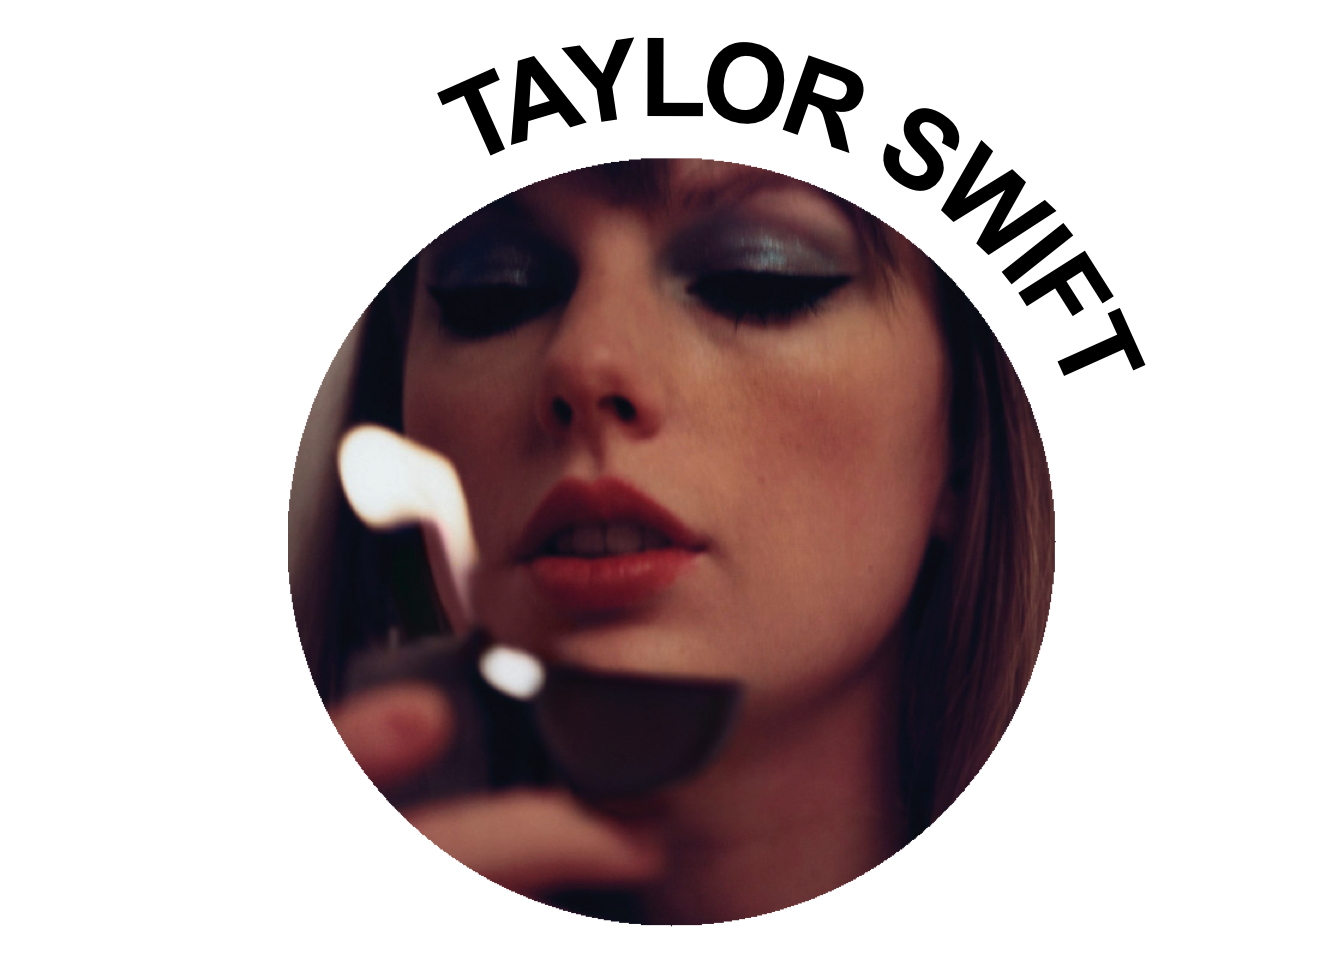
Just for fun, let’s try another one. With the additional arguments, we can modify the text font and position (top or bottom).
#image of taylor swift
image_url_v2<-"https://i.scdn.co/image/ab6761610000e5eb989ed05e1f0570cc4726c2d3"


plot_image_label(image=image_url_v2, label="COLDPLAY", position="bottom", font_color="#FC1264")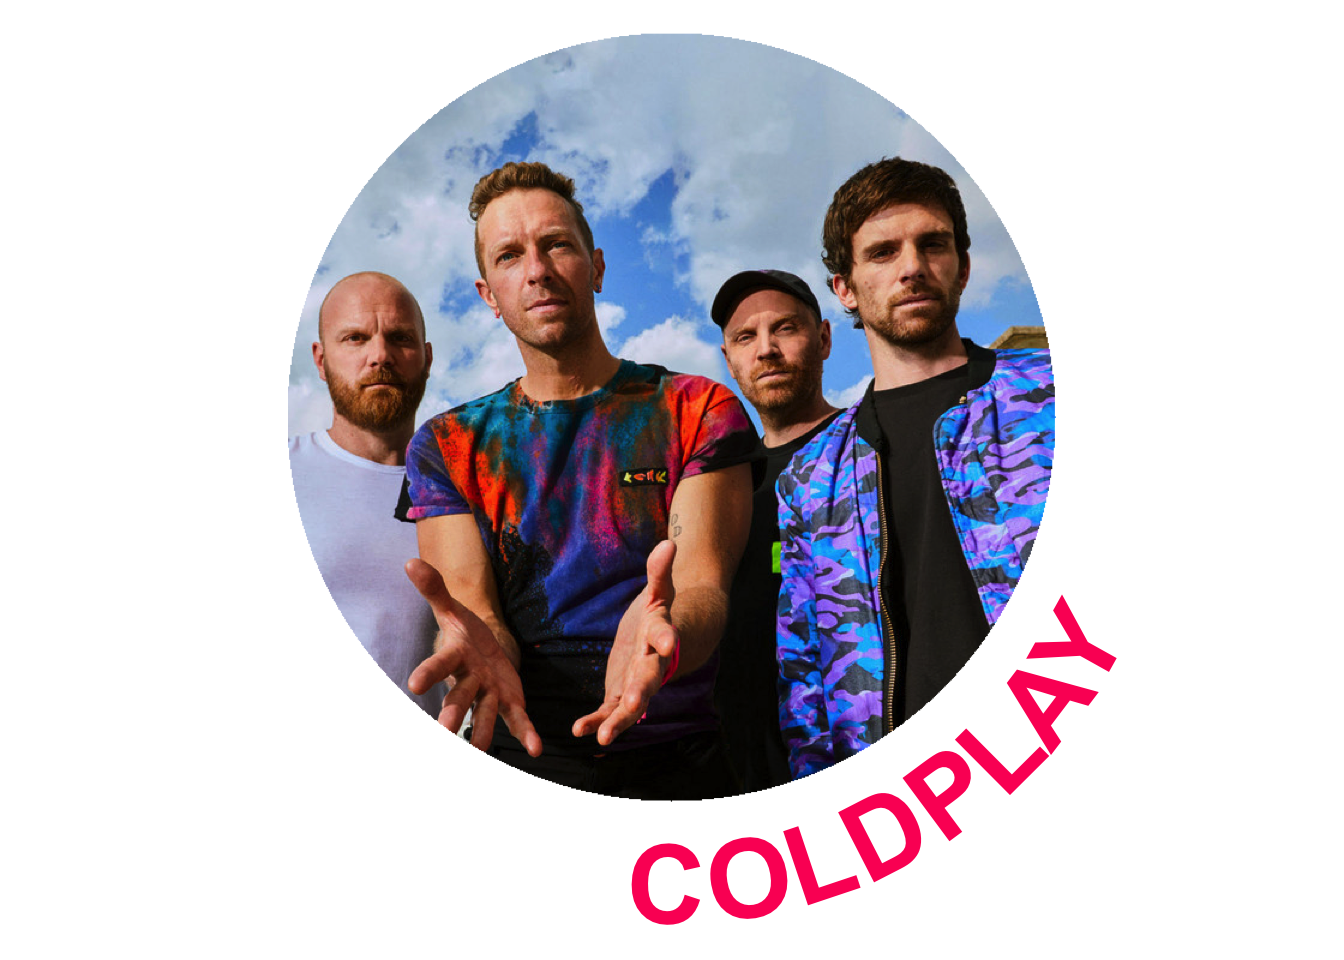
Maximizing Functionality
Of course, my end game was to use these images for plotting. To plot them with ggplot2, I ended up saving these circle-text-wrap images in a new folder with ggplot2::ggsave (the power of the for loop can never be underestimated). After saving them, I then used their new directory paths to plug into ggimage. To see how I did this step, you can see the full code on my GitHub.
Thank you for following along, that’s a ~ wrap ~ !